Tag: troubleshooting

  • SQL Server 2016 & Azure Query Store

    SQL Server 2016 & Azure Query Store

    I hadn’t been following the news much regarding SQL Server 2016, so when I did some reading the other day I was quite pleasantly surprised by some of the new features announced (not to mention that it looks like SSMS will finally be getting some much needed love). 🙂

    We’ve been having some frustrating intermittent performance issues recently, and I was struggling to gain much insight into what the issue was (since we’re using Azure Databases, so scope for troubleshooting is a little narrower than for on-premise SQL servers).  So when I read about the “Query Store” feature available in SQL Server 2016 and Azure Database (v12) I got quite excited.

    What is it?

    I’ll keep this short and sweet since there’s already a few good posts out there about the Query Store. Basically this feature allows you to track down queries which have “regressed” (i.e. it was performing well, and then all of a sudden it turned to crap for no apparent reason).

    Not only can you track them down, you can now “pin” the old (i.e. good) execution plan.  Essentially you’re overriding the optimiser and telling it that you in fact know better.

    Sweet! How do I do it?

    You could do this before now, by forcing plans using USE PLAN query hints, etc.  But the Query Store and it’s related new shiny UI makes it soooo much easier and “trackable”.
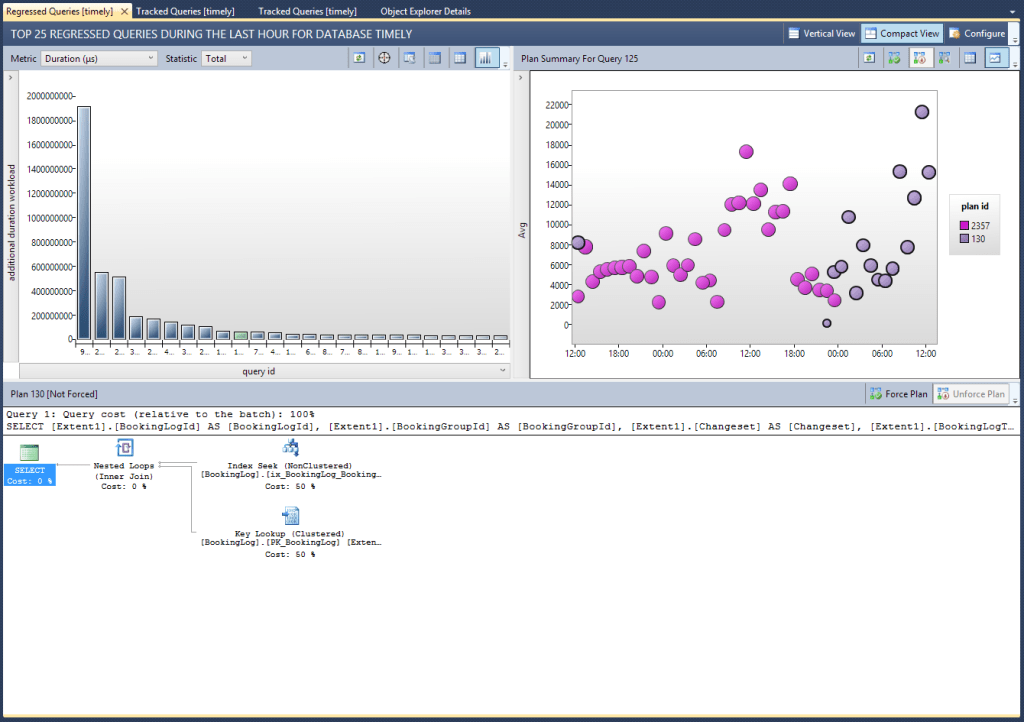
    Dashboard displaying a summary of regressed queries in SQL Server, highlighting query execution durations and plans.

    As I said before though, I’m not going to go into details about how to use it. I used this post to figure out how it works, how to force plans, how to monitor how it’s going, etc.

    Ok, so how did it help?

    Our problem was that we were seeing intermittent DTU spikes (remember, we’re on Azure, so this means we were maxing out our premium-tier database’s resources in some way, whether CPU, Disk I/O, etc). We tracked it down to a heavy stored procedure call which was running well 99% of the time, but would get a “bad plan” every now and then.  So we would see a spike in our app response time in New Relic, I’d jump into a query window and run an sp_recompile on this proc, and usually the problem would go away (until the next time).

    Obviously this wasn’t a sustainable approach, so I needed to either rewrite the proc to make it more stable, tweak some indexes, or force a plan.  I fired up the new “Regressed Queries” report (shown above) and it quickly highlighted the problem query.  From there it was a case of selecting the “good” plan, and hitting the “Force Plan” button. Well… I don’t trust buttons so I actually ran the TSQL equivalent, sys.sp_query_store_force_plan.

    Visual representation of tracked queries in SQL Server Management Studio with execution plan and query performance metrics.

    Some interesting observations

    In the above image you can see the forced plan (circles with ticks in them). What seems to happen, which initially threw me, is that when you force a plan SQL generates a new plan which matches the forced plan, but is picked up as a different plan by the Query Store.  Which is why you see the ticks in the circles up until the point you actually pin the plan, after which point you get a new, un-ticked plan.  At first I thought this meant it wasn’t working, but it does indeed seem to stick to this forced plan.

    Other uses

    I’ve also found the reports very useful even when not resorting to forcing plans.  In several cases I’ve found queries which aren’t performing as well as they should be, and either altered the query or some underlying indexes, and then seen the (usually) positive resultant new plans; as shown in the image below, where this query was a bit all over the place until I slightly altered an existing index (added 1 included column) and it has since settled on a better, more stable plan (in purple).

    A graphical representation of SQL Server query performance over time, showing various plan IDs with distinct colors, highlighting performance fluctuations and trends.

    Cheers,
    Dave

  • Look where you want to go

    My yellow machineI ride a motorbike to and from work every day. I thoroughly enjoy getting out on my Suzuki whenever possible – in fact I no longer even own a car. So obviously it was only a matter of time before I tried to wrangle in some kind of tenuous link between bikes and SQL Server. J So here goes…

    Quite a common mantra in the biking world is “look where you want to go”. The idea being that the bike goes towards where you’re looking; in other words, if you’re going around a corner, you should be looking through the corner to where you want to go, not staring at the road a few meters ahead of your front wheel.

    If you should look where you want to go, then we can assume that you shouldn’t look where you don’t want to go, right? Where this becomes really important is if/when you find yourself in a bad situation on the road. If you don’t want to ride into the pot-hole, or hit the back of the car which has suddenly stopped in front of you, then look for ways past the obstacle.

    Right, so what the hell does this have to do with the price of eggs?

    Well, a few days ago I was stuck in the office late, trying to fix a particularly stubborn issue with a new SQL instance. Everything had gone pretty smoothly, right up until the point that the full-text catalogues refused to build. I spent an hour or two trying everything I could think of, to no avail. So I went to the kitchen to make myself a coffee, and sat for a few minutes doing something completely unrelated to the full-text problem at hand (i.e. I whipped out the iPhone and read a few of the most recent blog posts I’d bookmarked in Instapaper).

    I returned to my desk, coffee in hand, and instead of diving straight back into what I had been trying (which obviously wasn’t working) I took a different tack and looked at the problem from a new angle. Another 15 minutes or so and I had the problem wrapped up.

    I had been so fixated on the problem that I could no longer think a way around it. This is the cause of many motorbike accidents, and it’s called “target fixation”. This is where the car pulls out in front of you and you think “WTF!? I’m going to hit their rear fender!”, shortly followed by you hitting their rear fender because that’s what you were staring at.

    Instead, we need to train ourselves to take in the fact that the car has pulled out, while also looking at the gap behind them which is still wide enough to fit through. Then once you’re safely through the gap, feel free to let loose the mighty single-digit salute. J

    Photo by hugo604bcThis incident reminded me to keep looking for alternative ways around a problem. This fix involved me using tools I don’t normally use, and looking at obscure logs which I normally don’t give a second thought – all of which made it that much more satisfying. So the next time you’re troubleshooting a stubborn issue, make sure you don’t get fixated on what’s right in front of you. Rather, look for a way around the inconsiderate prick in the car issue.

    Now go and give your server an oil change, and lube your chain. Ok, enough motorbike analogies (for today).

    Cheers,
    DB Dave

  • Snapshot isolation and tempdb growth

    Over the weekend we were alerted to a server running low on disk space. Not particularly exciting in itself, but the fact that it was happening on a relatively newly build SQL 2008 database server with a small database (~2.5GB) was interesting.

    This particular database belongs to one of our newer and smaller websites, and has READ_COMMITTED_SNAPSHOT enabled (we did this to prevent excessive blocking, which we ran into and weren’t able to control many other ways since this site is built using an ORM which generates the SQL commands on the fly).

    Anyway, getting back to the point; disk space was low because the tempdb data file was using around 15GB of space. I assumed that someone was explicitly  doing something to cause the blowout (index rebuilds, gnarly query, etc.) but I couldn’t find any culprits straight away.

    I then checked the sys.dm_tran_session_transactions DMV (after reading through one of Raj’s posts) which showed one particularly long running session (over 14 days in fact!). There were no open transactions that I could see, and the session itself had been suspended for practically all of those 14 days, so the reason I hadn’t seen it earlier was that most of my queries were inner-joining to sys.dm_tran_session_transactions which didn’t have a corresponding row. The query had a shared schema lock on 2 tables though, which is why the version store wasn’t flushing I guess.

    I had thought that the version store was only maintained while there was an open transaction though – so either there was an open transaction and I simply didn’t see it (I ran “DBCC OPENTRAN” with no results) or it was enough that the session held schema locks. Anyone have any ideas on this?

    The last command executed by the SPID was a relatively common & trivial one from the website, so it looks like it was an orphaned connection from the application – although how that happened we’re not sure. I killed the SPID and was then able to shrink the tempdb down to its usual level.

    I haven’t had much exposure to snapshot isolation, but at least now know to check for this if we have problems with tempdb growth in future. 🙂

    Cheers
    DB Dave