Tag: indexes

  • Keeping track of your SQL Server index “inventory”

    Keeping track of your SQL Server index “inventory”

    Something’s always bugged me when it comes to managing indexes in SQL Server; keeping track of when I created or dropped them.

    You can already check just about everything you could want to know about indexes, via handy DMV’s.  Need to figure out how much your indexes are being used? Take a look at sys.dm_db_index_usage_stats.  Or how about which indexes you might need to add to improve performance? Easy, just query sys.dm_db_missing_index_group_stats! You get the idea…

    But what about the create date of an index, or when it was last rebuilt, or even when you dropped an index? For this you need to roll up your sleeves and roll your own solution.

    How to skin this cat?

    There are a few ways we can do this.

    Scheduled job

    The first way I used to do this was to just have a scheduled job running fairly regularly (like every 15 – 30 minutes) which checked for any changes to indexes in the database since the last time it ran. Any new ones would be added to the table, changes would be recorded, and dropped indexes would noted as such.  In fact, I used a version of Kimberly Tripp’s “improved sp_helpindex” to gather and store the index information in a nice format (i.e. with separate columns for included columns, compression, etc).

    This is what the “guts” of the proc look like, just to give you an idea:

    DECLARE TimelyTables CURSOR FAST_FORWARD FOR
    		SELECT	DISTINCT 
    				QUOTENAME(ss.name) + '.' + QUOTENAME(st.name) AS TableName,
    				st.[object_id]
    		FROM	sys.tables AS st
    		JOIN	sys.schemas AS ss ON st.[schema_id] = ss.[schema_id]
    		WHERE	st.is_ms_shipped = 0;
    
    	OPEN TimelyTables;
    	FETCH NEXT FROM TimelyTables INTO @TableName, @ObjectId;
    	WHILE @@FETCH_STATUS = 0
    	BEGIN
    		TRUNCATE TABLE #tt_Indexes;
    
    		RAISERROR('Table: %s (%i)',10,1,@TableName,@ObjectId);
    
    		INSERT	#tt_Indexes
    		EXEC	dbo.sp_helpindex2 @TableName; 
    
    		IF @@ROWCOUNT > 0 
    		BEGIN 
    			INSERT	#index_history ([object_id], table_name, index_id, is_disabled, index_name, index_description, index_keys, included_columns, filter_definition, [compression]) 
    			SELECT	@ObjectId, @TableName, t.index_id, t.is_disabled, t.index_name, t.index_description, t.index_keys, t.included_columns, t.filter_definition, t.[compression] 
    			FROM	#tt_Indexes AS t;  
    		END 
    
    		FETCH NEXT FROM TimelyTables INTO @TableName, @ObjectId;
    	END

    Outside of this loop you can then do your MERGE comparison between “current” indexes, and what was recorded in the “index history” table from the previous run.

    DDL trigger

    DDL triggers are nothing new, but they can be very useful for auditing schema and login changes, etc. So it makes sense that this is ideally suited to creating an inventory of your indexes (if not all database objects that you might be interested in).  In fact, you can even quite easily create your own poor-man’s source control system, but that’s a different kettle of fish.

    The idea behind DDL triggers is that you specify which ‘events‘ you want them to fire for at a database or server level.  In my case, working with Azure, I’m only interested in database level events.  In fact, in this case I’m only interested in recording the details of any CREATE INDEX, ALTER INDEX, or DROP INDEX statements.  Which looks like this:

    CREATE TRIGGER trg_IndexChangeLog ON DATABASE 
        FOR CREATE_INDEX, ALTER_INDEX, DROP_INDEX 
    AS 
    ...

    Now we just insert the EVENTDATA data into our logging table, like so:

    IF OBJECT_ID('dba.IndexChangeLog') IS NOT NULL 
    BEGIN
    	DECLARE @data XML; 
    	SET @data = EVENTDATA(); 
    
    	INSERT	dba.IndexChangeLog(eventtype, objectname, objecttype, sqlcommand, loginname) 
    	VALUES	( 
    			@data.value('(/EVENT_INSTANCE/EventType)[1]', 'varchar(50)'), 
    			@data.value('(/EVENT_INSTANCE/ObjectName)[1]', 'varchar(256)'), 
    			@data.value('(/EVENT_INSTANCE/ObjectType)[1]', 'varchar(25)'), 
    			@data.value('(/EVENT_INSTANCE/TSQLCommand)[1]', 'varchar(max)'), 
    			@data.value('(/EVENT_INSTANCE/LoginName)[1]', 'varchar(256)') 
    			); 
    END;

    EVENTDATA is basically an XML document that contains the important bits you might want to record for auditing purposes… like who ran what, when.  This is what’s available:

    <EVENT_INSTANCE>
        <EventType>event </EventType>
        <PostTime>date-time</PostTime>
        <SPID>spid</SPID>
        <ServerName>name </ServerName>
        <LoginName>login </LoginName>
        <UserName>name</UserName>
        <DatabaseName>name</DatabaseName>
        <SchemaName>name</SchemaName>
        <ObjectName>name</ObjectName>
        <ObjectType>type</ObjectType>
        <TSQLCommand>command</TSQLCommand>
    </EVENT_INSTANCE>

    Best of both worlds?

    The above two methods are ones that I’ve already used successfully and have experience with – and each one offer pro’s and con’s.  I like the detail and “query-ability” of the data I get from the scheduled job solution, but the DDL trigger is simpler and doesn’t rely on scheduled jobs running.  The trigger also clearly has a big advantage in that it’s going to pick up the actual event as it happens, whereas the job may miss stuff between executions. This may or may not be important to you.

    There may be a nice way of combining the two though.  Using Event Notifications, or DDL triggers to insert a payload onto a Service Broker queue, you could have a live and asynchronous system which gathers more detail than what’s available in the EVENTDATA.  I.e. you could have an activated procedure on the end of the SB queue which uses the index name to populate additional details, for example. Let me know in the comments if you give this a go, or if you can see any gotchas.

    Cheers,
    Dave


  • SQL Server 2016 & Azure Query Store

    SQL Server 2016 & Azure Query Store

    I hadn’t been following the news much regarding SQL Server 2016, so when I did some reading the other day I was quite pleasantly surprised by some of the new features announced (not to mention that it looks like SSMS will finally be getting some much needed love). 🙂

    We’ve been having some frustrating intermittent performance issues recently, and I was struggling to gain much insight into what the issue was (since we’re using Azure Databases, so scope for troubleshooting is a little narrower than for on-premise SQL servers).  So when I read about the “Query Store” feature available in SQL Server 2016 and Azure Database (v12) I got quite excited.

    What is it?

    I’ll keep this short and sweet since there’s already a few good posts out there about the Query Store. Basically this feature allows you to track down queries which have “regressed” (i.e. it was performing well, and then all of a sudden it turned to crap for no apparent reason).

    Not only can you track them down, you can now “pin” the old (i.e. good) execution plan.  Essentially you’re overriding the optimiser and telling it that you in fact know better.

    Sweet! How do I do it?

    You could do this before now, by forcing plans using USE PLAN query hints, etc.  But the Query Store and it’s related new shiny UI makes it soooo much easier and “trackable”.

    Dashboard displaying a summary of regressed queries in SQL Server, highlighting query execution durations and plans.

    As I said before though, I’m not going to go into details about how to use it. I used this post to figure out how it works, how to force plans, how to monitor how it’s going, etc.

    Ok, so how did it help?

    Our problem was that we were seeing intermittent DTU spikes (remember, we’re on Azure, so this means we were maxing out our premium-tier database’s resources in some way, whether CPU, Disk I/O, etc). We tracked it down to a heavy stored procedure call which was running well 99% of the time, but would get a “bad plan” every now and then.  So we would see a spike in our app response time in New Relic, I’d jump into a query window and run an sp_recompile on this proc, and usually the problem would go away (until the next time).

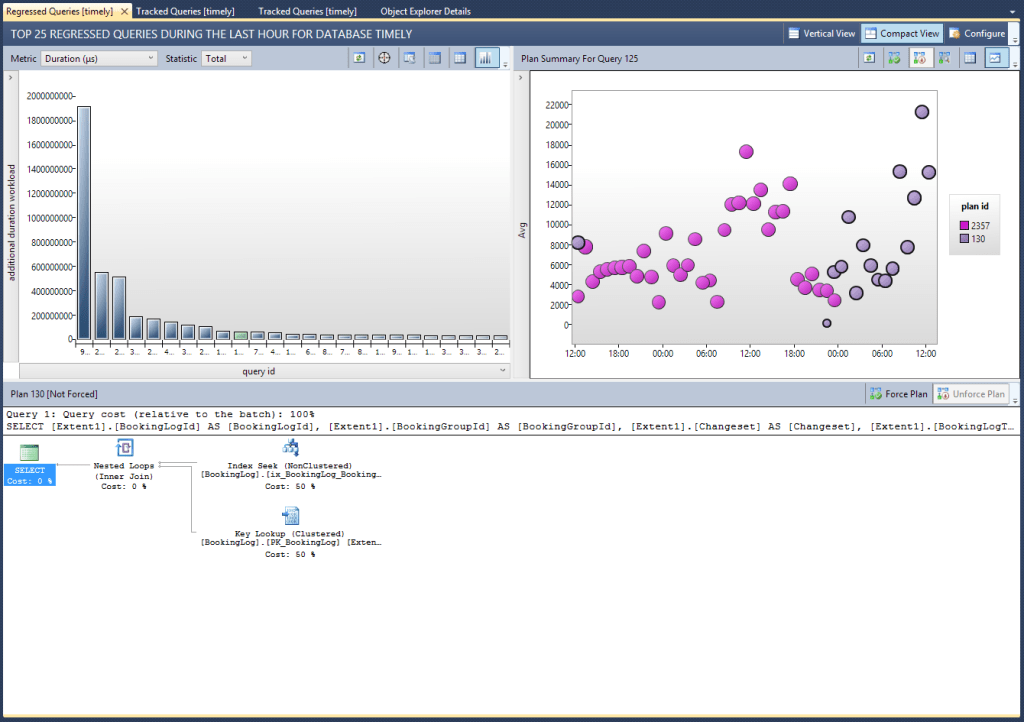
    Obviously this wasn’t a sustainable approach, so I needed to either rewrite the proc to make it more stable, tweak some indexes, or force a plan.  I fired up the new “Regressed Queries” report (shown above) and it quickly highlighted the problem query.  From there it was a case of selecting the “good” plan, and hitting the “Force Plan” button. Well… I don’t trust buttons so I actually ran the TSQL equivalent, sys.sp_query_store_force_plan.

    Visual representation of tracked queries in SQL Server Management Studio with execution plan and query performance metrics.

    Some interesting observations

    In the above image you can see the forced plan (circles with ticks in them). What seems to happen, which initially threw me, is that when you force a plan SQL generates a new plan which matches the forced plan, but is picked up as a different plan by the Query Store.  Which is why you see the ticks in the circles up until the point you actually pin the plan, after which point you get a new, un-ticked plan.  At first I thought this meant it wasn’t working, but it does indeed seem to stick to this forced plan.

    Other uses

    I’ve also found the reports very useful even when not resorting to forcing plans.  In several cases I’ve found queries which aren’t performing as well as they should be, and either altered the query or some underlying indexes, and then seen the (usually) positive resultant new plans; as shown in the image below, where this query was a bit all over the place until I slightly altered an existing index (added 1 included column) and it has since settled on a better, more stable plan (in purple).

    A graphical representation of SQL Server query performance over time, showing various plan IDs with distinct colors, highlighting performance fluctuations and trends.

    Cheers,
    Dave

  • Identifying unique indexes that aren’t defined as unique

    Confused? So am I, but after changing the title of this post about a dozen times this is what we’re left with… 🙂

    I was in the process of examining some indexes on our test Denali server (see previous posts) when I decided to check how many of our non-unique, non-clustered indexes are actually made up of a unique column (or a unique combination of columns in the case of a compound index). In other words, which non-clustered indexes could I convert to UNIQUE non-clustered indexes? I whipped up a script to do this and thought I’d share.

    If you’re wondering why I might want to do this; I’m interested to see what impact it has on index storage, as well as read performance. I’m by no means saying you should go and recreate all of your NC indexes as unique – remember that this script will return all indexes where the *current* data in the table is distinct. There are no guarantees that future inserts & updates won’t cause the data to become non-unique (and break your application).

    Here’s the script. It’s pretty straight forward, and simply returns a list of tables/indexes at the moment, but could easily be change to actually output the CREATE / DROP_EXISTING commands instead.

    SET NOCOUNT ON;
    DECLARE @i INT = 1,
    		@rc INT,
    		@cmd NVARCHAR(2000),
    		@tablename NVARCHAR(128),
    		@indexname NVARCHAR(128),
    		@collist NVARCHAR(1000),
    		@rowcount INT,
    		@rowcount_d INT;
    
    DECLARE @tt_ncidxs TABLE (rowid INT IDENTITY, [object_id] INT, [object_name] VARCHAR(128), [index_id] INT, index_name VARCHAR(128), [index_columns] VARCHAR(1000), is_unique BIT);
    
    WITH IndexColumns AS
    (
    	SELECT	DISTINCT
    			i.[object_id],
    			QUOTENAME(OBJECT_NAME(i.[object_id])) AS [object_name],
    			i.[index_id],
    			QUOTENAME(i.[name]) AS [index_name],
    			STUFF(
    					(
    					SELECT	', ' + QUOTENAME(COL_NAME([object_id], column_id)) AS 'data()'
    					FROM	sys.index_columns AS t2
    					WHERE	c.[object_id] = t2.[object_id]
    					AND		c.index_id = t2.index_id
    					FOR		XML PATH ('')
    					), 1, 2, ''
    				) AS 'index_columns'
    	FROM	sys.indexes AS i
    	JOIN	sys.index_columns AS c ON c.[index_id] = i.[index_id] AND c.[object_id] = i.[object_id]
    	JOIN	sys.objects AS so ON i.[object_id] = so.[object_id]
    	WHERE	i.is_unique = 0
    	AND		i.is_unique_constraint = 0
    	AND		so.is_ms_shipped = 0
    	AND		so.[type] = 'U'
    )
    INSERT	@tt_ncidxs ([object_id], [object_name], [index_id], [index_name], [index_columns])
    SELECT	[object_id],
    		[object_name],
    		[index_id],
    		[index_name],
    		[index_columns]
    FROM	IndexColumns
    
    --SELECT * FROM @tt_ncidxs
    SELECT @rc = @@ROWCOUNT;
    
    WHILE @i <= @rc
    BEGIN
    	SELECT @cmd = NULL, @rowcount = NULL, @rowcount_d = NULL, @tablename = NULL, @collist = NULL;
    
    	SELECT	@tablename = [object_name],
    			@indexname = index_name,
    			@collist = [index_columns]
    	FROM	@tt_ncidxs
    	WHERE	rowid = @i;
    
    	RAISERROR('Table %s column list: %s', 10, 1, @tablename, @collist) WITH NOWAIT;
    
    	SET @cmd = 'SELECT @x_rowcount = COUNT(*) FROM ' + @tablename + ' WITH (NOLOCK);'
    	EXEC sp_executesql @cmd, N'@x_rowcount INT OUTPUT', @x_rowcount = @rowcount OUTPUT;
    
    	SET @cmd = 'SELECT @x_rowcount_d = COUNT(*) FROM (SELECT DISTINCT ' + @collist + ' FROM ' + @tablename + ' WITH (NOLOCK) ) x;'
    	EXEC sp_executesql @cmd, N'@x_rowcount_d INT OUTPUT', @x_rowcount_d = @rowcount_d OUTPUT;
    
    	RAISERROR('Index %s on table %s selectivity = %i/%i', 10, 1, @indexname, @tablename, @rowcount_d, @rowcount) WITH NOWAIT;
    
    	IF (ISNULL(@rowcount, 1) = ISNULL(@rowcount_d, 2)) -- i.e. column values are (currently) distinct/unique
    	UPDATE @tt_ncidxs
    	SET is_unique = 1
    	WHERE rowid = @i;
    
    	SET @i += 1;
    END
    
    -- Get a list of non-unique nonclustered indexes whose index columns are currently distinct.
    -- These *may* be candidates for conversion to UNIQUE nonclustered indexes instead.
    -- NB: PLEASE MAKE 100% SURE THAT THE COLUMNS ARE ALWAYS GOING TO BE UNIQUE BEFORE CREATING A UNIQUE INDEX
    SELECT	*
    FROM	@tt_ncidxs
    WHERE	is_unique = 1
    ORDER	BY [object_name], [index_id]

    Cheers
    DB Dave